In the era of the information explosion, there is no doubt that we are getting impatient to properly and correctly interpret the information we receive. There is too much to read and digest, especially in a modern busy world. What we receive reshapes how we think if there is no filter or logic gate to help us clarify what is true and fake. “The number bias: how numbers lead and mislead us.” written by Sanne Blauw gives us some clues to check the information, data, and news we receive every moment in our daily lives.
Number Is Not Everything
Numbers cannot be the reason for us to stop thinking. Number helps us see the world but it is not the whole world. Not everything is measurable. Something important might not be measurable. For example, a restaurant service can be fast (easy to measure) but with low quality in human interaction (more challenging to measure). We cannot look at one side only. The number cannot reveal the whole facts or stories. Therefore, it is crucial be aware of the margin errors derived from something not measurable or capturable.
Number Can Be Wrong
Bias in statistics happens for multiple reasons. Below is a checklist for us to think about more next time when observing the result of data analysis.
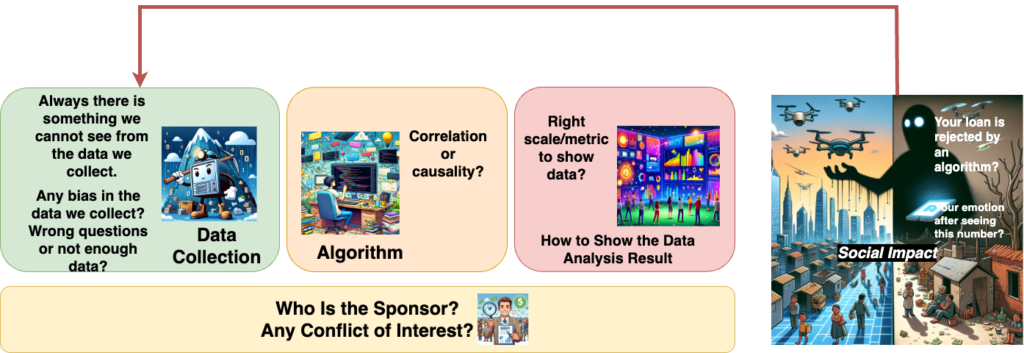
1. How We Collect Data
Several questions worth for us to think twice when collecting data.
- Do we collect enough amount of data?
- How do we run the sampling? Do we merely focus on the specific group of samples?
- Is it a survey where people are unwilling to participate or answer questions such as sex or privacy-related topics?
2. Who Is the Sponsor behind the Survey
If researchers have a pre-defined position on the survey result, it is a disaster for the whole survey. They might ask the wrong questions in a survey or survey those people who can support their perspectives or positions. People even like data experts unconsciously fall into the trap of self-supported perspectives. So, do not directly trust the interpretation you have of a number. There are different ways to interpret a number. Try to study the evidence that is in contrast to what you believe.
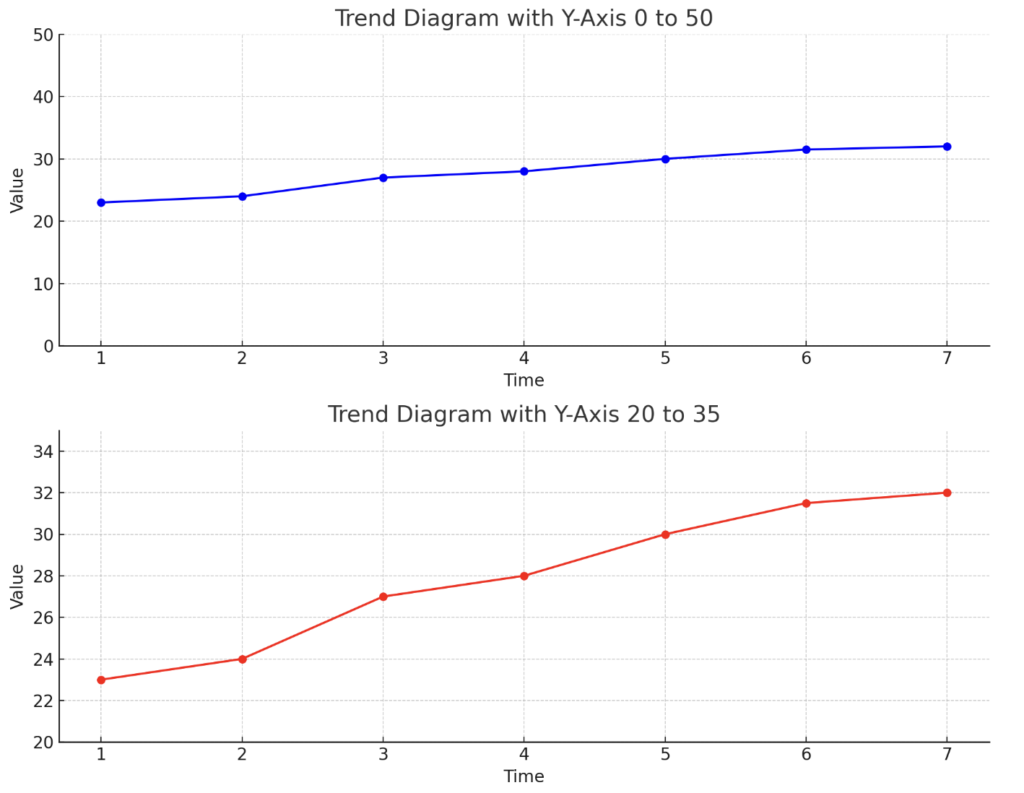
3. The Way of Showing the Survey Result
The scaled metrics on the diagrams can make how you feel quite different. See the diagram below: the same sequence of numbers but with different scales on the y-axis can make you feel quite different.
4. Correlation Is Not Equal to Causality
Correlation is not equal to causation. Which is the cause? What is the effect? Is it because people unfold umbrellas that cause the rain? Is it because of coincidence or unseen reasons? It is easy to be suspicious of the causation but very difficult to confirm causation. How to resolve this? The answer for now: repetitive validation and accumulating the evidence of study. Do not draw the conclusion from a one-time study or experiment.
As the book mentions, “the core of science is being suspicious.” It is essential to keep exploring the facts behind numbers and challenge what we used to believe. How we believe what we see changes the way society works. The use of data has a social impact on each of us. The algorithms designed by data decide if you and I are eligible to receive the resources. The bias inside can make the poor even poorer and the rich even richer which is an ethical issue in modern society.